Geo Maps
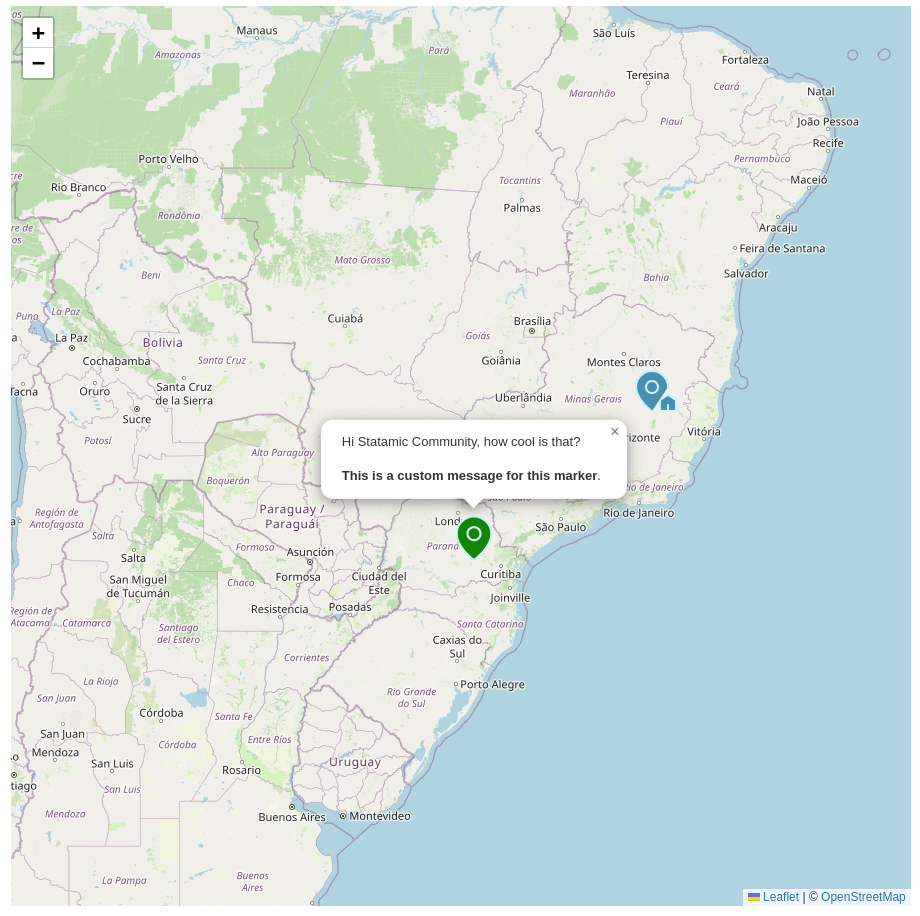
Geo Maps is a Statamic addon that empowers users to seamlessly embed dynamic, customizable maps into their pages using tags.
It leverages the power of Leaflet JS, an open-source JavaScript library widely known for its simplicity, performance, and versatility in creating interactive maps.
Additionally, Geo Maps integrates Lucide, an open-source icon library offering over 1000 high-quality vector (SVG) icons. Lucide enhances the package by providing visually appealing, scalable icons and symbols that complement the map displays. These icons are ideal for markers, ensuring an intuitive and aesthetically pleasing user experience.
We recognize and deeply value the contributions of the open-source community, as projects like Leaflet JS and Lucide are essential for driving innovation and accessibility. By utilizing these robust tools, Geo Maps not only delivers advanced mapping features but also underscores the importance of collaboration and shared resources in creating modern, user-centric solutions.
Features
This addon does:
- Customizable Markers: Easily add markers with personalized icons and popup messages to highlight specific locations.
- Flexible Map Configuration: Adjust map size, center, zoom level, and toggle between light or dark modes to suit your design needs.
- GeoJSON Integration: Display complex geospatial data effortlessly by loading GeoJSON from variables or external URLs.
- Interactive Popups: Enable users to click on the map to retrieve latitude and longitude information seamlessly (available in basic maps).
How to Install
You can install this addon via Composer:
composer require iagofelicio/geo-mapsHow to Use
Once installed, the Geo Maps addon integrates seamlessly into your Statamic project by providing a set of intuitive tags.
Loading required libs
Geo Maps has a special tag responsible for adding all the necessary libs. This includes linking the required Leaflet JS and Lucide assets, along with any additional stylesheets or scripts needed to ensure your maps function smoothly.
{{ map:requirements }}By placing this tag in your template's or page's <head> section, you ensure that your maps have all the foundational components they need to render correctly and interactively.
Example usage:
<head> <!-- Other libs --> {{ map:requirements }}</head>Tip: In fact, you can add this tag anywhere, but it is common to put it in the head tag.
Creating maps
1. Blank Map
The simplest way to add a map to your page is by using the {{ map }} tag. This single tag renders a blank map with default settings, providing a quick and easy starting point. By using this default setup, you can immediately display a functional map, which can later be customized with additional options and parameters described in the sections below.
The default options include:
- Predefined id, width and height
- Automatically adjusting the color scheme to light or dark mode based on user preferences.
- Predefined latitude and longitude values to mark the center of the map.
- A default zoom level and max zoom allowed.
- Enabled popups that display the latitude and longitude of the location where you click on the map, making it especially useful for discovering geospatial information during map development.
These options can be changed as in the example below:
{{ map id="yourCustomId" # Default: random id width="100%" # Default: 500px height="500px" # Default: 500px colorScheme="light" # Options: light or dark. Defaults to system preference if colorScheme not provided. popup="true" # Default: true center="[-23,-48]" # Must be in the format [lat,lon]. Default: [0,0] zoom="5" # Default: 1 maxZoom="15" # Default: 20}}Important: Map IDs on the same page cannot be the same.
Tip: Sometimes when inserting maps inside some HTML elements with dynamic size calculation, the map may not be displayed if you try to use width and height equal to 100%. In these cases, it may be necessary to place a div with a well-defined size and the map tag inside it.
2. Single Marker
To add a marker to the map you must use the method below. All parameters of a blank map are customizable with the exception of the popup option which is set to true when there are markers.
{{ map:marker # Other map options ... lat="-23" # Required lon="-48" # Required zoom=7 # If not informed, it will be used "5" center="[-23,-48]" # If not informed, the lat and lon values will be used text="I'm the message to be visualized when someone click the <b>popup</b>.<br>This is a link that redirects you to Google: <a href='https://google.com'>Link</a>" icon="map-pin-house" # Default: map-pin. It can be any icon from Lucide color="#ed5d69" # Fill color. Default: #3591b3 strokeColor="#c7f4fe" # Outline color. Default: #c7f4fe strokeWidth="2" # Default: 1 iconSize=35 # Default: 42}}Color Format Support
The color and strokeColor fields accept various CSS formats beyond standard Hex codes. Supported formats include:
/* HEX Codes */#ffffff#fff /* RGB and RGBA */rgb(10, 20, 30)rgba(170,221,255,0.59) /* HSL and HSLA */hsl(208,56%,46%)hsla(208, 56%, 46%, 1) /* OKLCH (With Alpha support) */oklch(35% .18 125)oklch(65% 0.18 145 / 50%) /* CSS Variables */var(--my-color) /* Named Colors */black, silver, gray, white, maroon, red, purple, fuchsia, green, lime, olive, yellow, navy, blue, teal, aqua ... /* Full list can be found at: https://developer.mozilla.org/en-US/docs/Web/CSS/Reference/Values/named-color*/HTML Content & Sanitization
The content of the text attribute is sanitized using the mewebstudio/Purifier package to prevent XSS attacks.
Please note that some HTML tags or attributes may be stripped out if they are not allowed by the purifier's default configuration.
3. Multiple Markers
You can add as many markers as you want. However, to add more than one, use the following method. (Note that the method is plural).
# Consider the array $markers:{{? $markers = [ 0 => [ "color" => "#7c51ad", "icon" => "locate-fixed", "lat" => -21, "lon" => -41, "iconSize" => 30, "strokeWidth" => 1, "text" => "Message for marker 3" ], 1 => [ "color" => "#b84141", "lat" => -25, "lon" => -53, "iconSize" => 35, "strokeWidth" => 1, "text" => "I'm the message for <b>marker 4</b>." ]]?}} # You should now pass the array of markers to the tag.{{ map:markers # Other map options ... center="[-22,-51]" # If not informed, the default will be used markers="{{ $markers }}"}}This approach is useful for organizing multiple markers in a clean and concise way.
4. GeoJSON
GeoJSON is a format for encoding a variety of geographic data structures.
A working example of GeoJSON can be found in the files directory of this repository.
There are two ways to pass GeoJSON content to the map:geojson method:
4.1. Content
Suppose the page where you will insert the map has a variable with GeoJSON content or, as in the illustrative case below, a global variable stores content in GeoJSON format.
{{ map:geojson center="[-15,-51]" zoom="7" data="{{globals:geojson}}"}}The above code is enough to insert the map including the desired content.
4.2. URL
Another scenario is through URLs. Whether to a file on your own site or to an external URL, the tag will read the GeoJSON content and plot the map.
Example 1:
{{ map:geojson center="[-15,-51]" zoom="7" url="{{ link to="/assets/sample.geojson" absolute="true" }}"}}Example 2:
{{ map:geojson center="[-15,-51]" zoom="7" url="https://raw.githubusercontent.com/Iagofelicio/geo-maps/refs/heads/main/files/sample.geojson"}}Tip: You will notice that when you click on each GeoJSON object, a table of properties is displayed. The tag is programmed to display any properties that exist, inspect the example GeoJSON to understand how to include information in the popups.
Contributions
Do you have any ideas on how to improve this add-on? Create an issue on Github and I'll try to analyze all cases and suggestions as soon as possible.


